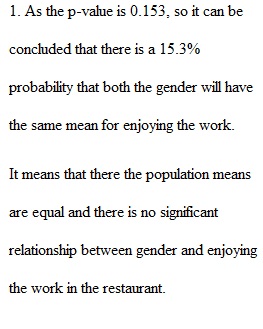
Q Assignment About Motivating Your Restaurant Employees! https://www.youtube.com/watch?v=f7xQ4u4KFEE (Links to an external site.) (The above video is from Ed Debovics Deli, in Chicago. Do not look at it if you are rushed for time! Ed Debovics is a deli known for having employees who "act rude" to make the restaurant experience humorous.) In the assignment, below, you will come up with statistics-based suggestions for motivating Santa Fe Restaurant Employees! Specifically, please read chapter 11 of your text, then answer the following Review Questions (RQ) and Discussion Questions (DQ) at the end of the chapter: RQ #1 – Explain the difference between the mean, the median and the mode. RQ #2 – Why and how would you use Chi-square and t-tests in hypothesis testing? RQ #3 – Why and when would you want to use ANOVA in marketing research? RQ #4 – What will ANOVA tests not tell you, and how can you overcome this problem? DQ #7 SPSS EXERCISE. Data: 3e_Employee Database_Santa Fe Grill_N=77_final-1 (1).sav Using SPSS and the Santa Fe Grill Employee database, provide frequencies, means, modes, and medians for the relevant variables on the questionnaire. The questionnaire is shown in Chapter 10. In addition, develop bar charts and pie charts where appropriate for the data you analyzed. (It is not difficult to use SPSS or PSPP to run bar charts and pie charts. However, if you prefer to show findings without producing bar chats or pie charts, I will understand.) Finally, and most importantly, run an ANOVA using the work environment perceptions variables to identify any differences that may exist between male and female employees, and between part-time versus full-time employees. Clearly explain the primary findings of the ANOVA (particularly, the p-values) and their relevance to you as a manager of the restaurant! ---------------- Hint: Go to ANALYZE - COMPARE MEANS - One-Way ANOVA. Put the employee work perception variables in the Dependent Variables List and Type of Worker as a factor. Then, run again, using the employee work perception variables in the Dependent List and Gender as a factor. In the ANOVA analyses, check the bottom Statistics box, Descriptives. Then, the means of the different variables will also be calculated for you. Two added hints! Added Hint !! In this assignment, and many others, you will get a p-value. A p-value, here, is the probability that the two groups are NOT different (on the variable that you are examining). For example, I see that the p-value for x20 (gender) and x1 is .024. This p-value, the probablility that the two genders are NOT different, is .024. To determine if the two groups (female and male) are indeed different, recognize that the answer is 1 - the p-value, or 97.6%!! Added Hint 2!! Start a little bit early, and follow my steps. If you have a problem, click the "Secret Help Button" : Course Secret Marketing Research "Help" Button. Also read: Secret Thanksgiving Hint About the Analyses That Follow!!
View Related Questions